R and SPSS: When Are They Worth It?
Both R and SPSS are tools for statistical modeling and academic research purposes. The are specialized business analytical tools for doing analysis and are optional. Python does all that businesses require, and therefore, you will only need R and SPSS if you work on projects requiring them.
Do I Need to Know How to Code?
Coding is not mandatory, Excel, PowerBI and Tableau do not need any. SQL uses English like short commands, and Python is also optional but increases your options.
Tool | Coding needed? | Indicative time to working proficiency* |
Excel | No | 3–4 weeks |
SQL | Light | 3–5 weeks |
Power BI / Tableau | No (light formulas) | 4–6 weeks |
Python | Yes, basic | 8–12 weeks |
R / SPSS | Some | 6–8 weeks |
*These timings are estimates for about five hours of practice per week. Your pace may differ.
Excel and the dashboard tools are quick wins, so start there. These business analytical tools used for analysis get harder as you go down the table, which is why the order matters.
Power BI vs Tableau: Which Should You Prioritize?
Power BI and Tableau are two widely used tools for creating business analytics dashboards. Both help turn raw data into visual reports, but they differ in pricing, device compatibility, features, and workplace integration.
You do not need to master both at the same time. Start with the tool that best matches your career goals, available resources, and the software used by your target employers.
Power BI vs Tableau: Key Differences
Comparison Factor | Power BI | Tableau |
Cost | Power BI Desktop is free. Power BI Pro costs ₹1,165 per user/month, billed yearly, plus GST. | Creator licence costs approximately $75 per user/month, billed annually. |
Operating System | Desktop application is available only for Windows. | Desktop application supports both Windows and Mac. |
Integration | Integrates closely with Excel, Microsoft 365 and Teams. | Connects with multiple data sources and works well across different technology environments. |
Learning Curve | Easier to learn if you already know Excel. | Basic features are easy to understand, but advanced visualisation takes more practice. |
Dashboard Design | Offers clean, practical dashboards for business reporting. | Provides greater flexibility for creating detailed and customised visualisations. |
Free Learning Option | Power BI Desktop is free for Windows users. | Tableau Public offers a free option for creating and sharing visualisations publicly. |
The Power BI pricing is based on the Microsoft's India pricing page. Tableau pricing is indicative and needs to be checked on the official site before making the purchase. Tableau Public is free, but the published visualizations are public.
Which Is Easier for Beginners?
Both products use drag and drop screens, so the process of chart construction is performed by dragging fields and not coding. Most people find Power BI easier at the beginning stage if they are familiar with Excel, as the interface and formulas are quite similar. The same happens with Tableau: it starts with ease, but the advanced features, such as complex calculations, can be quite hard to master. It depends on your experience, so you should try both products for an hour with their free versions.
Which One Do Employers Want?
Apply the easy rule: check the job postings for the positions you are targeting, determine which product is mentioned more often, and learn it thoroughly. Learn another product at the elementary level so you can understand the conversation about it. The demands change every year, every city and every industry, so we cannot give any definite answer to that question here. Many of the business analytics software tools used in the industry overlap, so skills in one transfer to the other.
Can I Use a Mac?
Yes, with some limits.
Power BI Desktop: It is a Windows-only app, with no native Mac version.
Power BI in the browser: The Power BI service runs in Safari or Chrome on a Mac. It is good for viewing and light editing, but not every Desktop feature is available.
Virtual machine: You can run Windows on your Mac with tools like Parallels and install Power BI Desktop there.
Tableau: Tableau Desktop supports Mac, so it is the simpler choice for Mac users.
Always look at Microsoft’s and Tableau’s official websites for the latest information prior to installation.
Choosing between Power BI and Tableau is one part of preparing for a career in business analytics. You should also evaluate the curriculum, practical learning opportunities and industry exposure offered by an MBA. Read about the features of top online MBA programs in India before making your choice.
Take the Next Step Towards an AI-Ready Career with ATLAS SkillTech University’s Online MBA Build business, analytical and leadership skills with the two-year, UGC-recognised Online MBA course from ATLAS SkillTech University. Its AI-native curriculum combines management fundamentals, hands-on projects and AI-powered learning to help you apply data and technology to real-world business decisions. Key Highlights University Recognition: Pursue a UGC-recognised MBA from an institution with NAAC A+ accreditation. UGC Recognition: UGC-recognised degree with NAAC A+ accreditation. AI-First Learning: Gain hands-on experience with tools like Excel, Claude, Perplexity and GA4. Practical Projects: Build AI-powered products, agents and business solutions. Flexible Duration: Complete the 87-credit programme in 2 years, with up to 4 years allowed. Programme Fee: ₹2,50,000 + ₹1,000 registration fee.
Explore the ATLAS SkillTech University to learn more about its AI-focused curriculum, admission requirements and learning experience. |
How an Online MBA Teaches These Tools (and How to Practice Them)
Online MBAs train students in analytics tools via live classes, recorded videos, case studies and projects. This portion demonstrates a sample learning pathway, the method of teaching the tools, the way of checking an MBA program, and the way of practicing business analytics tools for free.
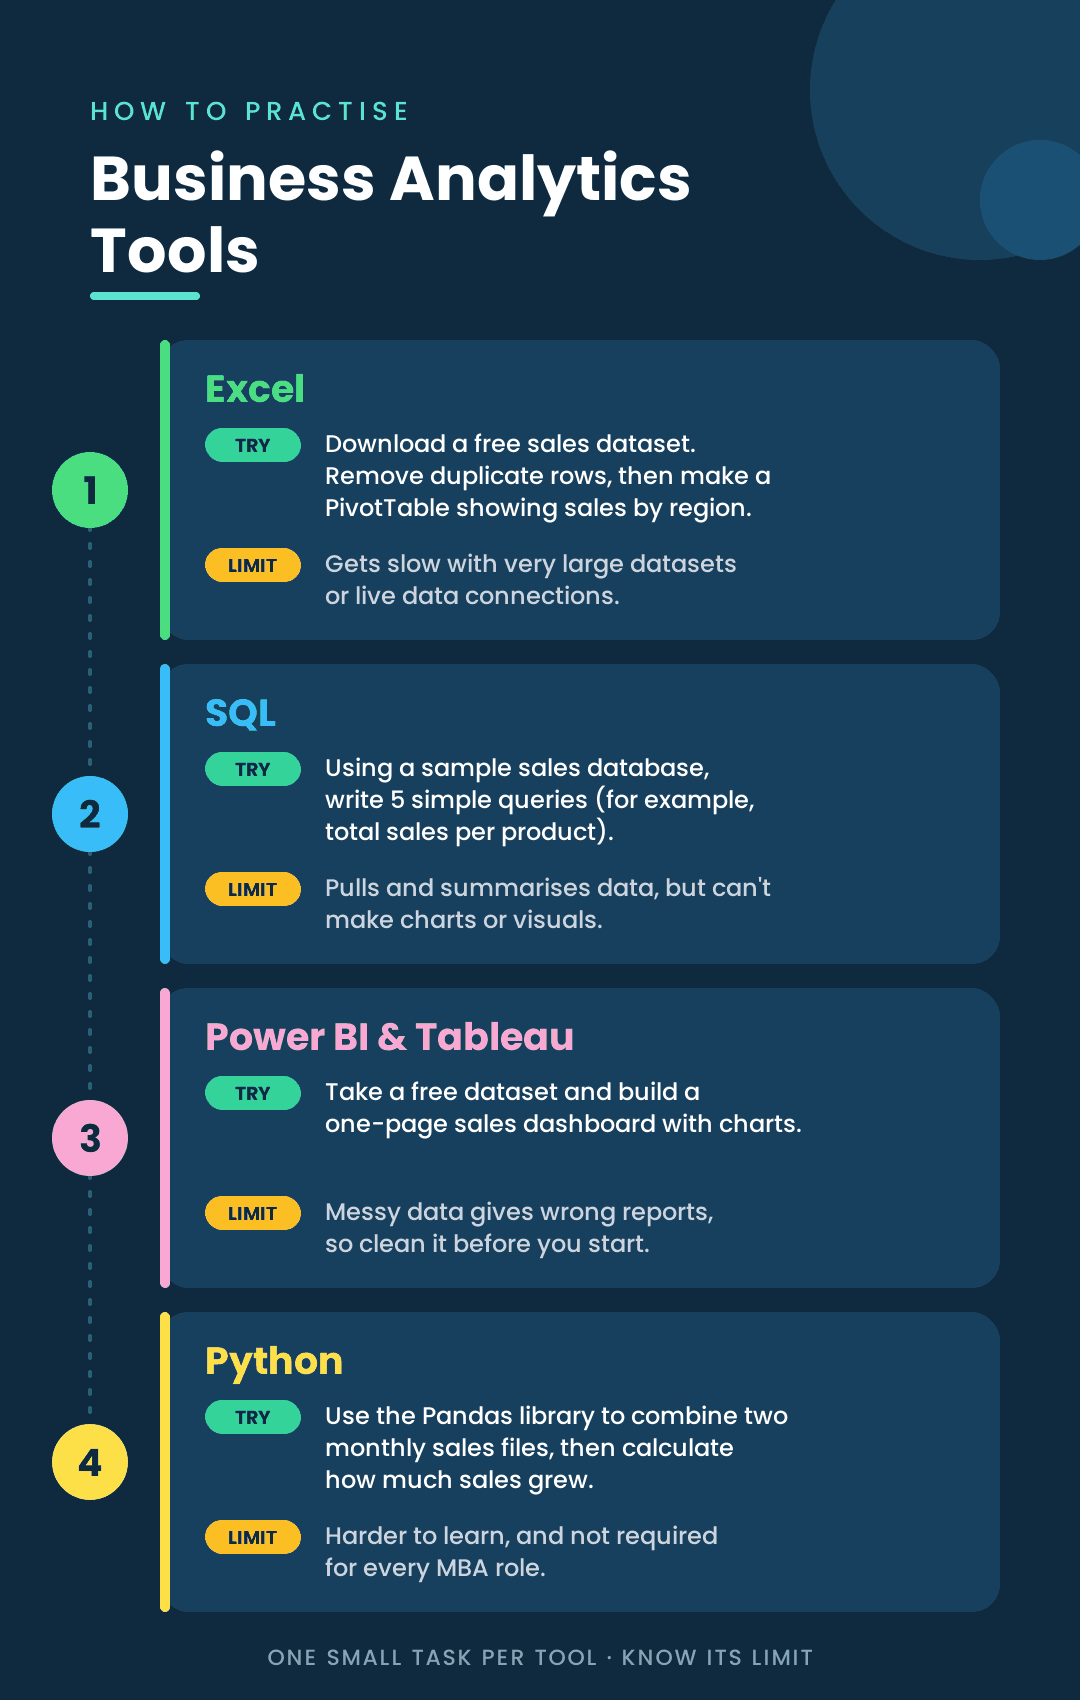
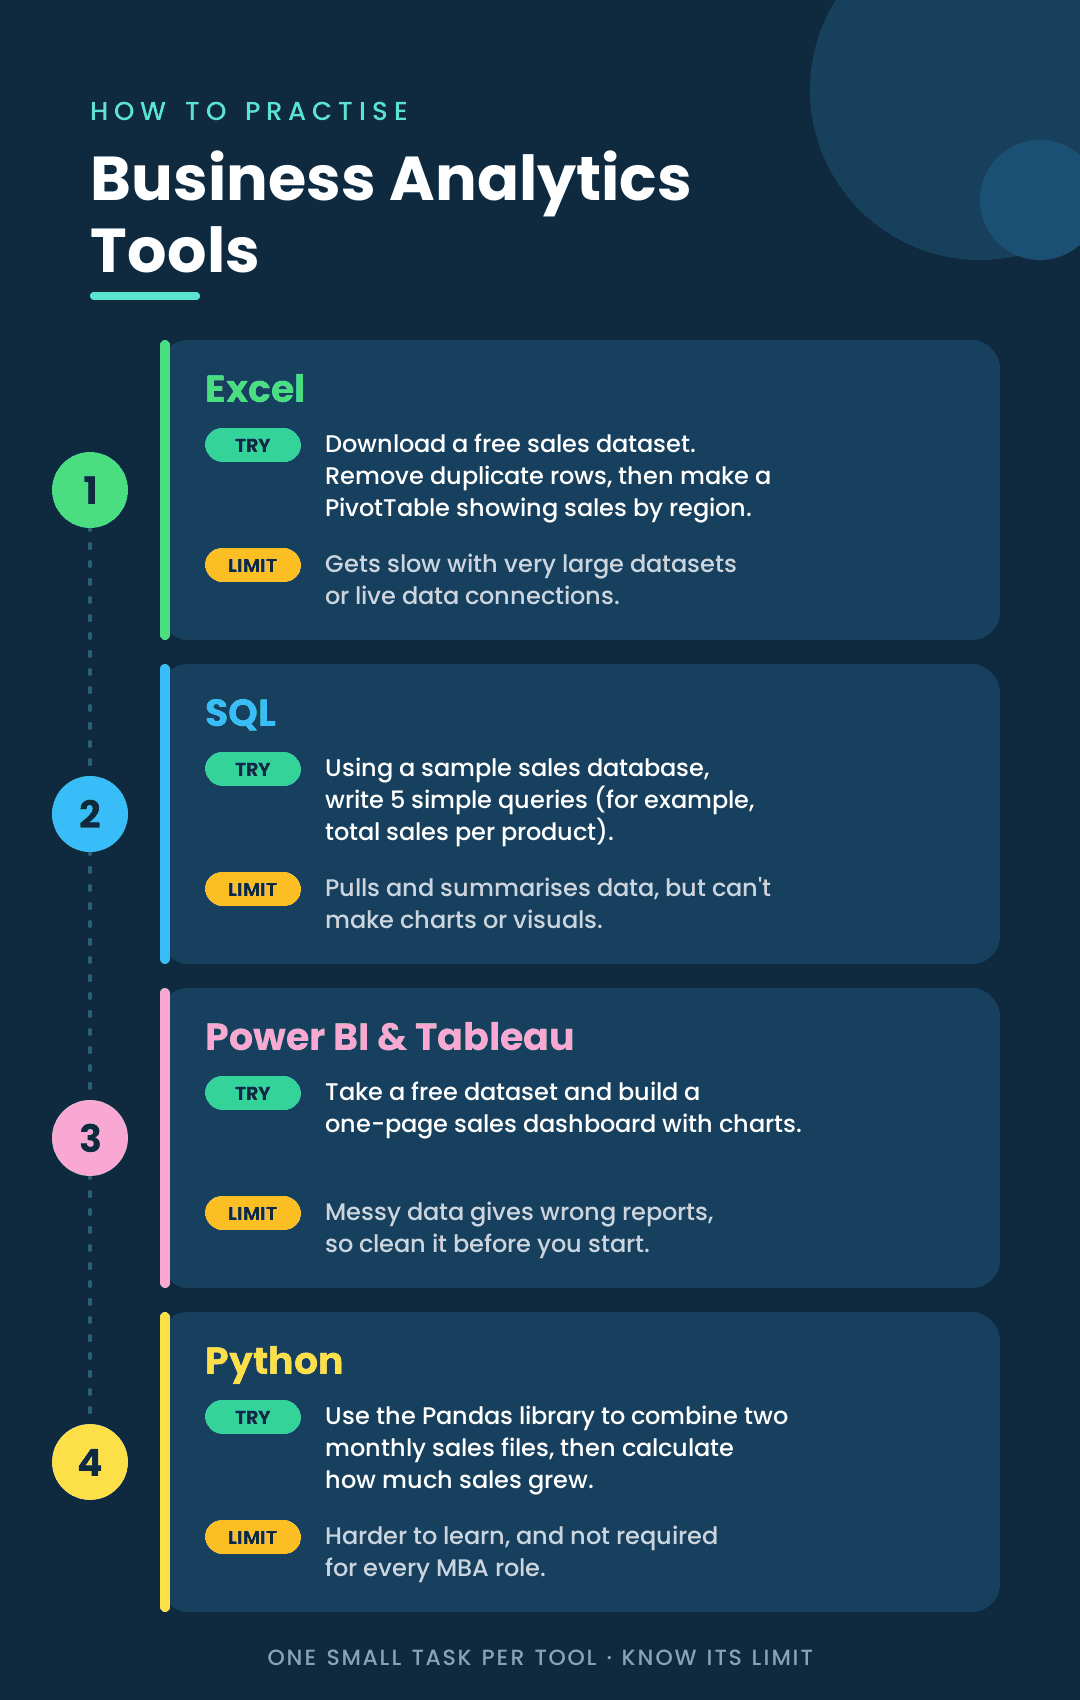
Learn in phases: Programs begin with Excel and statistics, then progress to SQL, dashboards and Python. Learning in phases prevents students from getting overwhelmed.
Solve case studies: Case studies and data sets demonstrate how the use of business analytics tools in India helps in making business decisions in sales, finance and marketing departments.
Complete projects: Projects and capstone allow you to have completed pieces of work, such as a dashboard, that you can showcase to potential employers.
Refer to the curriculum: Good programs include the business analytics tools used in their syllabuses.
Practise by yourself: Free-to-use business analytics tools, such as Tableau Public and Looker Studio, help in acquiring skills independently.
When Do You Learn Each Tool?
This is an illustrative path. Actual curricula vary by university.
Semester | Focus | Tools |
Semester 1 | Foundations | Excel and statistics |
Semester 2 | Data access and visuals | SQL and data visualisation |
Semester 3 | Dashboards and coding | Power BI or Tableau, and Python |
Semester 4 | Capstone | All tools combined with AI features |
Think of it as a ladder. Each semester adds one new skill on top of the last one.
How Are Tools Taught Online?
Coursework teaches the top business analytics tools and techniques through case studies, practical data sets, software labs, group assignments and a capstone project. You listen to or attend a lecture and then implement it on actual data. That is how the business analytics tools, which can be used for analysis, are made into skills.
A portfolio-quality assignment includes these components: a data set that has been cleaned, a KPI dashboard and a short business recommendation. For example, you could create a retail sales dashboard and write three lines recommending which product to promote next month.
How to Check a Program Teaches the Right Tools
When you decide on enrolling, evaluate whether the course fits this list of business analytics tools.
Business analytics tools mentioned in the syllabus: The syllabus must mention tools, not just “analytics.”
Hands-on assignments: Find labs, cases and capstone projects, not just video lectures.
Software licences: Learn about business analytics software tools available during the course.
Software that works on Mac/Windows: Confirm that the tools run on your system.
Skill assessment: Check how tool skills are tested, such as through projects or practical exams.
Industry instructors: Prefer teachers who have used these tools at work.
Can I Practice Without Paying?
Yes. Several business analytics tools free of charge are enough to build real skills. Free versions have limits, so read each tool’s current terms.
Power BI free version: Build a sales dashboard from a free dataset. Sharing reports with others needs a paid plan.
Tableau Public: Build a chart story on public data. Your workbooks are public, so never upload private company data.
Looker Studio: Connect a Google Sheet and make a basic marketing report.
Python with Jupyter: Open a free notebook and analyze a CSV file with Pandas.
Public datasets: Use websites such as Kaggle or data.gov.in. Such business analytics tools are among the best places to practice, since you learn much faster using real data than hypothetical ones.
What Mistakes Should I Avoid?
Learning all business analytics tools at once: Choose one tool at a time and complete a project before switching to another.
Skipping SQL and statistics: You risk having fancy dashboards with incorrect numbers without them.
Creating dashboards without the initial business question: Always start with "what decision will this help me to make?"
Ignoring data cleaning: Inconsistent data produces incorrect results, and the process of cleaning is time-consuming anyway.
Thinking that the tool is the skill: The mentioned business analytics tools for analysis are useful only when used correctly.
When comparing MBA programs, also consider the university's accreditation, curriculum, learning support and industry exposure. Explore the best online MBA colleges in India to understand what different universities offer.
Which Tools Matter for Your MBA Role, and How AI Is Changing Them
The right tools depend on your MBA specialisation. A marketing manager and a finance manager need different tools. AI is also changing how these best business analytics tools in India are used. This section covers the best business analytics tools for each role and how AI is changing them.
Marketing roles: Use Excel, GA4 and a dashboard tool to track campaigns, leads and cost per customer.
Finance roles: Use Excel, SQL and Power BI for budgets, variance reports and forecasts.
Operations roles: Use SQL and Python to forecast demand and spot delays in the supply chain.
People and general management roles: Use Excel and Power BI to track hiring, attrition and key performance numbers.
Industry fit: Learn the business analytics software tools used in the industry you want to join first, then add others.
Which Tools Fit My Specialization?
Specialization | Primary tools | Typical task |
Marketing | Excel, GA4, Power BI or Tableau | Track campaign results and cost per lead |
Finance | Excel, SQL, Power BI | Build budget vs actual reports |
Operations / supply chain | Excel, SQL, Python | Forecast demand and find delays |
HR | Excel, Power BI | Track hiring and attrition |
General management | Excel, Power BI | Read KPI dashboards and make decisions |
Here is a list of top business analytics tools grouped by role. The presence of Excel in each row explains its place on the list. Salary and career information is provided in another article.
Is AI Replacing These Tools?
No. AI tools speed up the process, but do not replace the tools and the person using them. One needs to formulate the business question, pick the correct data, and verify the results. AI might provide a confident yet incorrect answer, so never trust any output without verification.
AI assistants are part of the business analytical tools applied during analysis, and your personal insight is what makes it valuable.
What AI Features Should I Learn?
Start with these two areas.
Natural-language queries: There are a lot of BI tools that allow users to type a business question in plain English and receive a chart as a response.
AI assistants: They might help in writing SQL, cleaning the data, and composing initial insights. Some AI features might be available only in paid versions of the tool.
Here is a short example prompt: “Show total sales by region for last quarter and point out the region with the biggest drop.” Then check the numbers yourself against the raw data. Using AI well is now one of the business analytics techniques every beginner should practise.
Marketing professionals use business analytics tools to track campaign performance, measure customer acquisition costs and make data-backed decisions. If you are considering this career path, explore the salary after an online MBA in Marketing to understand potential earnings and career opportunities in 2026.
Why Choose Atlas Skilltech University for Online MBA?
ATLAS SkillTech University presents an UGC-approved, 2-year online MBA course focused on artificial intelligence-based projects. In case you are willing to kick start your knowledge of business analytics tools in India, you have got a great program with career-focused education.
Recognised Degree: The above program is UGC approved, and the university mentions NAAC accreditation. Ensure both from the official website prior to applying for the program.
Flexible Duration: It takes 2 years and covers 4 semesters, amounting to 87 credits. With 4 years to complete, you are free to study along with your full-time occupation.
Eligibility Criteria: All you require is a bachelor's degree with at least 50% aggregate score.
Excel in Semester 1: The course “Driving Decisions by Excel & Modern Age AI Tools” (3 credits) is in Semester 1. Excel is a business analytics tool, and this subject builds that base.
AI-first learning: You work with tools such as Claude, Perplexity, Lovable, Bolt.new, PostHog and GA4 through projects that feed your Builder Score.
Learning support: You get an AI-powered learning platform with live classes and recordings, plus career readiness support such as resume and mock interview tools.
Clear fees: The total fee is ₹2,50,000, which is ₹62,500 per semester. A one-time, non-refundable ₹1,000 registration fee applies, and no-cost EMI options are available. First-attempt exam fees are included, and re-attempts cost ₹400 per paper.
Conclusion
Learning business analytics tools helps you turn raw data into useful business decisions. Start with Excel, SQL, Power BI or Tableau, and then move to Python as your skills grow. Practise through small projects and explore business analytics tools free of cost before investing in paid software. Choose tools based on your MBA specialisation and career goals. Most importantly, combine technical skills with business knowledge and AI to analyse data and make better decisions.